URA Property Prices Index – Is it a time for change?

In today’s blog, I am going to talk about URA property prices index or PPI for short. Sorry folks. Today’s topic will be very technical and dry. It’s all about data and numbers. So I will go straight to the point.
As we all know. We always refer to URA PPI to get a sense of the market through their statistics. I mean. It has always been a close reference for most consumers to get a sense of the market on the ground. However, in the past years. I have realized that the PPI may not be a reflection of what is actually happening on the ground. That is why sometimes I get pretty puzzled.
Nevertheless, I will dissect the PPI and see how can it be further improved upon. In addition, please stay until the end of this video because I have a bonus tip for you.
URA Property Prices Index
URA’s private residential PPI reflects the broad price trends in Singapore’s private residential market.
Do you know the first revisions to the PPI methodology trace back to 2000? Then, the PPI was further revised back in 2015 to take into account the greater variation in the unit size and age of private housing developments.
As mentioned in this article. It states that the revision was to account for the greater diversity in unit size and age. For example, more shoebox units since the last index revision. The current model includes taking into consideration the tenure, completion status, property type, and location. In addition, the size and age of the property and its proximity to MRT station were added in 2015.
URA further added that there is a change in methodology from the stratification method to the stratified hedonic regression method. Seriously, don’t ask me what is this. I recall I learned them during my Uni days but I think I have left them all behind with my lecturers.
Anyway, I am a very practical person. Let me dissect URA PPI with the data on the ground just to give you a better understanding.

Comparing URA PPI and Edge prop data
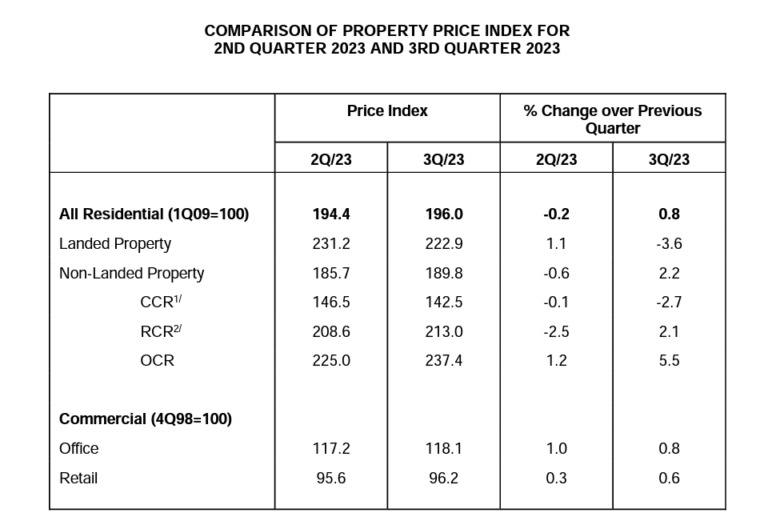
Here, let me take reference with URA PPI from the 1st to 3rd quarters of 2023. It this table, it states that for all residential prices. From 2Q 2023 to 3Q 2023. The index has increased by an overall of 0.8%. If we look further into the numbers. The data is split into 2. It comprises both landed property and non-landed property. For today’s discussion. I will only focus on non-landed property which is mainly apartments and condominiums.
From 1Q 2023 to 2Q 2023. The PPI for non-landed declined by 0.6%. Subsequently, from 2Q 2023 to 3Q 2023. The PPI for non-landed increased by 2.2%. These figures are extracted from the difference between each quarter of the PPI. How does URA derive the exact PPI? Seriously, I don’t know. We can only take reference from the regression method that they have used.
For today’s study, I decided to compare these numbers using edgeprop data. Let me compare them on a quarterly basis. I have selected all apartment and condominium transactions for all districts, all tenure, and all ages for our comparison. The results are pretty astonishing. From 1Q 2023 to 2Q 2023. The data from Edgeprop increased by 3.9%. Then from 2Q 2023 to 3Q 2023. The data decline to 5.4%. This is a significant difference from URA data.
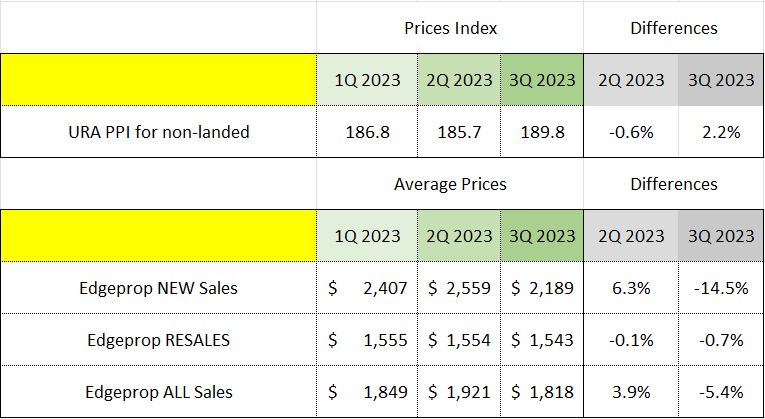
Hence, I decided to break up edge prop data into new sales, all sales, and resale transactions. This is to see if there are any differences between the various segments.
Interesting. These are the numbers. For new sales in 2Q 2023, the increase was 6.3%. This is followed by a decline of 14.5% in the 3Q 2023. For the resale segment. Prices declined by 0.1% in the 2Q followed by another 0.7% decline in the 3Q. Overall, prices for all sales increased by 3.9% in 2Q followed by a decline of 5.4% in the 3Q. In this way, I believe you can see a clearer picture of how different segments are performing rather than lumping them as non-landed altogether.
However, the data from edgeprop don’t seem to tally with URA PPI. Most likely, I think I calculated it wrongly. Please don’t take me too seriously. Ok? After all, I am only a property agent doing bo liao YouTube.
Anyway, let me finish my comparison and compare them on a yearly basis. This will give us a better gauge of the market due to short-term fluctuation.
Comparing URA PPI on a Yearly Basic
For the next set of data. I will be comparing them on a yearly basis. Let me zoom into URA PPI first from 2019 to 2023. I have painstakingly extracted them from the URA website. All these are public information. I have attached all the links in the description below. You are more than welcome to explore them by yourself.
Here, I will use 2019 as a base point as this is the year before COVID-19. The PPI for non-landed increased by 2.5% in 2020. Ah…this is the very same year Covid strike. How come prices still increase?
Never mind. We will come back to this later.
The PPI increase by 9.8% in 2021, 8.1% in 2022, and 4.2% by the end of 3Q 2023.
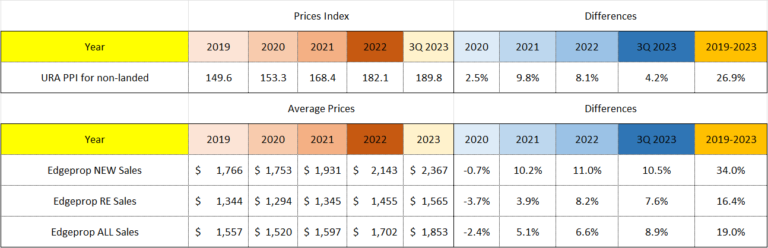
Here, let me break up edgeprop data into new sales, all sales, and resale transactions all again. Firstly, let us look into new sales first. New sales declined by 0.7% in 2020 due to a lack of new launches in a Covid year. In fact, developers back then are trying to clear stock for those launches in the early years from 2018 to 2019. For those who bought those remaining units through Zoom. All of you confirm huat now.
Subsequently, new sales prices increased from 10.2% in 2021 to 11% in 2022 and 10.5% till 3Q 2023. When developers outbid others for land, land cost goes up, construction costs go up, and a pent-up demand after Covid. All lead to higher prices. As we all know. The rest is history.
Let us return to resale prices in 2020. Prices declined by 3.7%. This makes sense to me. If you can all remember. Resale owners are motivated to sell lower due to news reporting that Covid will cripple the economy and lead to job losses and so on. There are fear-mongering in the market. Sellers are more flexible in their pricing. Some property analysts even predict that property prices will crash with a looming recession that is even worse than SARS.
Bad news coupled with restrictions to view houses led to a decline in prices in 2020. Subsequently, resale prices start to pick up from 3.9%, 8.2% and 7.6% between 2021 to Q3 2023.
In the last row, we have the overall sales figures for the respective years. And if we compare them against URA non-landed PPI. There are still significant differences between the 2 sets of data.
What I can assume is that the new sales data may have distorted the overall URA PPI. As we all know, the gain achieved by new homes has outperformed the resale market in recent years.
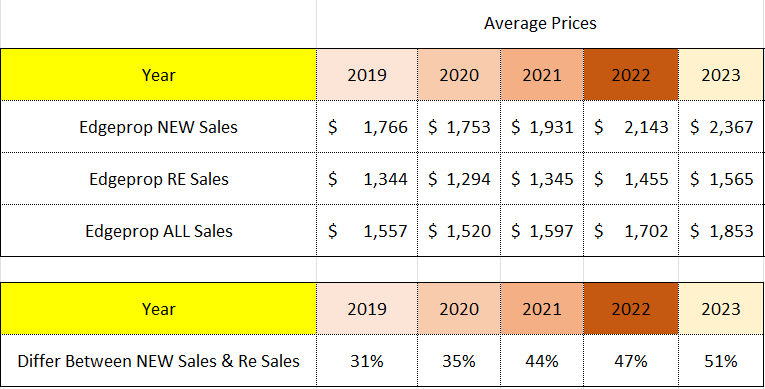
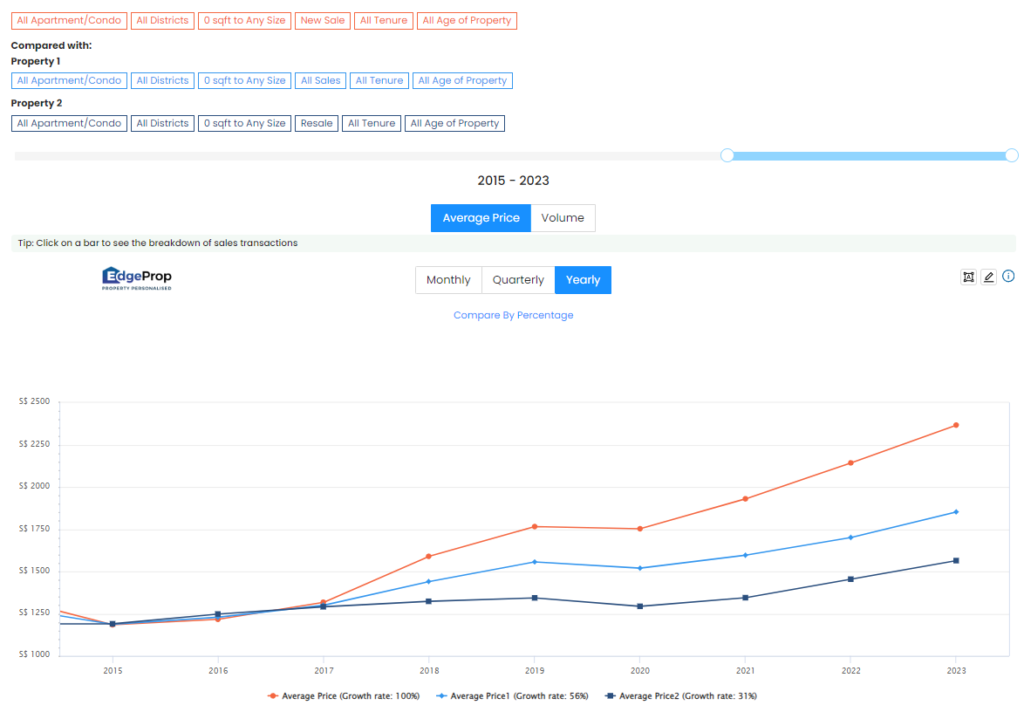
Lastly, let me paint a broader picture and compare them from 2019 to 2023. Back in 2019, new homes were selling for an average of $1,766psf. In 2023, this figure has jumped to $2,367psf. This means new home prices have increased by a stunning 34%.
On the other hand, resale prices back in 2019 were hovering around $1,344psf. In 2023, prices average $1,565psf or a 16.4% increase during the same period.
What do these 2 sets of numbers mean to you? Does it mean new sales outperform the resale market? Yes. Indeed, this is true. As a property buyer and property seller. How will this affect you?
Out of curiosity, let me compare the difference between new sales and resales in recent years. Interestingly, the difference between them is 31% in 2019. These figures continue to increase from 35% in 2020, 44% in 2021, 47% in 2022 and lastly 51% in 2023. What will the figure be in 2024? I am very sure it will continue to go higher with record breaking land bids as mention in my earlier video.
Conclusion
To sum up. Don’t get me wrong. I still believe in URA data as they have full access to all transactions in Singapore. However, I think there is room for improvement. The last revision was in 2015 when they took into account the widespread of shoeboxes units. This time rounds. I think it is the new home market that may distorted the overall PPI. It will be good if URA can further break down the PPI like what I have shared so that consumers can make informed decisions.